We know serving is incredibly important. Winning the “Serve-Pass Battle” often decides who wins the match. Yet, serving is still an elusive skill for many coaches. In order to get better at coaching it, it might be help to understand how good our players actually are at it.
In the GMS Stats app, we display a few statistics. One of them is Knockout % (KO %). In fact, when we display the Key Factors for Opponent Sideout, Knockout % is the stat we choose to be the representative serving statistics.

Knockout % is a simple statistics to calculate:
(Aces+Bad and Medium Passes) / (All Serves)
So, as you might have guessed, Knockout % is representing, “how often did you knock the other team out-of-system?” If you missed your serve, they weren’t knocked out-of-system. And if they made a good pass, they weren’t knockout out-of-system.
So we like KO % because it combines, “serving in,” with, “serving tough.”
Here’s a concrete example from a club coach (thanks Scott!) who shared some of his team data with us:
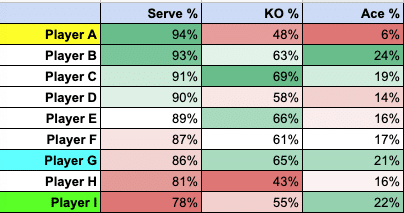
This table is sorted by Serve-In %. Now let’s look at the next table:
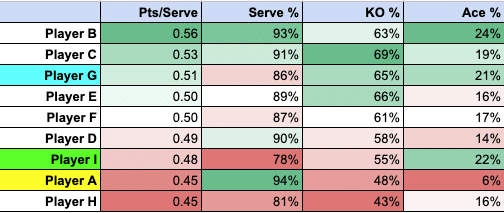
This one is sorted by Pts/Serve, which is ultimately the most important statistic for a server. When they serve, how often do they score a point and how often does the other team win the point?
We can see that, while Player A fared quite well on the Serve-In rankings, she doesn’t do so well on actual serving effectiveness. So she’s, “serving in,” but not, “serving tough.” In contrast, Player I served very tough. Her Ace % is the second-highest on the team. Yet, she didn’t serve in enough to score a high amount of points for her team.
Player G is an interesting one. She missed a lot of serves, yet her serves were tough when they were in. Despite missing more serves than most of the other top servers on her team, her KO % was high, and she ended up being very effective.

We can also see that Serve-In % hardly correlated with Pts/Serve at all. Just, “serving in,” doesn’t get it done. We see that Ace % correlates quite a bit better. So, “serving tough,” gets you closer to the ideal.
But we also see that KO % correlates better than either Serve-In % or Ace %. This statistic that combines, “serve in AND serve tough,” gives us a statistic that measures the effectiveness of our servers better than a statistic that only measures one of them.
The final thing we like about KO % is that is easy to for players to understand. It’s a “human scale” statistic. You can see that the best servers on this team have KO % that are about 67%. This is what we tend to find at the high school or club level. 67% is, “2 out of 3,” which is easy for players to understand and set short-term performance goals for themselves. It also translates well into drill design.
If you haven’t been using KO %, now’s the time to start!