

Hitting Percentage In Volleyball – The Metrics We Use And What They (Don’t) Tell Us
Definitions of the statistics mentioned in this article:
- Hitting % (also referred to as Attack Efficiency):
- (Kills – Errors) / Total Attempts
- Kill %:
- Kills / Total Attempts
- Error %:
- Errors / Total Attempts
Using data to gain an objective understanding of how a team or individual performs over the course of a match or season has been around in our sport for a long time. Many of the metrics we use today are ones that have been around for just as long. But with advances in technology and more readily available understanding of statistical concepts, it may be time to reexamine our use of these metrics, and to make sure we understand what they are and aren’t telling us.
| TOKYO OLYMPICS MEN’S VOLLEYBALL OUTSIDE HITTERS HITTING % (minimum 50 attempts) | ||||||
| TEAM | PLAYER NAME | KILLS | ERRORS | TOTAL ATTACKS | HITTING % | HITTING % RANK |
| POLAND | Wilfredo Leon | 85 | 14 | 149 | .477 | 1 |
| ITALY | Osmany Juantorena | 97 | 14 | 179 | .464 | 2 |
| CANADA | Gordan Perrin | 66 | 13 | 121 | .438 | 3 |
| USA | Taylor Sander | 65 | 16 | 118 | .415 | 4 |
| ITALY | Alessandro Michieletto | 74 | 13 | 154 | .396 | 5 |
| IRAN | Meisam Salehi | 71 | 20 | 130 | .392 | 6 |
| FRANCE | Trevor Clevenot | 106 | 35 | 201 | .353 | 7 |
| BRAZIL | Ricardo Lucarelli | 88 | 26 | 180 | .344 | 8 |
| JAPAN | Yuki Ishikawa | 90 | 25 | 191 | .340 | 9 |
| USA | TJ Defalco | 64 | 20 | 133 | .331 | 10 |
| FRANCE | Earvin Ngapeth | 124 | 43 | 246 | .329 | 11 |
| BRAZIL | Leal | 91 | 28 | 197 | .320 | 12 |
| RUSSIA | Egor Kliuka | 85 | 27 | 183 | .317 | 13 |
| ARGENTINA | Facundo Conte | 112 | 36 | 250 | .304 | 14 |
| ARGENTINA | Cristian Poglajen | 26 | 10 | 53 | .302 | 15 |
While the ability to compare attack efficiencies has its merits, efficiency alone provides insight on a limited scope in two major ways:
1) By definition, attack efficiency is equivalent to taking kill percentage (k/att) and subtracting error
percentage (e/att). Combining these two pieces in this way essentially yields a plus-minus calculation
for attacking and as such, tells us more about how kills and errors are related to each other, and less
about the rate at which kills or errors are being made overall. Using a simple example to illustrate
further, two athletes with 100 attack attempts and .300 efficiency can be vastly different – one athlete may have 40 kills and 10 errors while the other has 60 kills and 30 errors. These are two very different attacking performances, but looking at efficiency alone does not show the difference between them.
2) Attack efficiency (and thereby, kill percentage and error percentage) takes only the attack into account without any consideration of how difficult the attack attempts were (i.e. first contact quality). For example, let’s take the same simple example with two athletes (Athlete 1 and Athlete 2) with .300 efficiency. Now let’s say all of Athlete 1’s attack attempts are out of system and all of Athlete 2’s attack attempts are in system. This added context sheds a very different light on Athlete 1’s .300 attack efficiency to Athlete 2’s .300 attack efficiency.
To hit on Point 1, let’s go back to our sample data from the Olympics and see how each of the top 15 Outside Hitters by efficiency rank in both kill percentage and error percentage.
| TOKYO OLYMPICS MEN’S VOLLEYBALL OUTSIDE HITTERS HITTING %, KILL %, & ERROR % | |||||||
| TEAM | PLAYER NAME | HITTING % | HIT % RANK | KILL % | KILL % RANK | ERROR % | ERR % RANK |
| POLAND | Wilfredo Leon | .477 | 1 | 57.0% | 1 | 9.4% | 3 |
| ITALY | Osmany Juantorena | .464 | 2 | 54.2% | 5 | 7.8% | 1 |
| CANADA | Gordan Perrin | .438 | 3 | 54.5% | 4 | 10.7% | 4 |
| USA | Taylor Sander | .415 | 4 | 55.1% | 2 | 13.6% | 6 |
| ITALY | Alessandro Michieletto | .396 | 5 | 48.1% | 11 | 8.4% | 2 |
| IRAN | Meisam Salehi | .392 | 6 | 54.6% | 3 | 15.4% | 16 |
| FRANCE | Trevor Clevenot | .353 | 7 | 52.7% | 6 | 17.4% | 19 |
| BRAZIL | Ricardo Lucarelli | .344 | 8 | 48.9% | 9 | 14.4% | 11 |
| JAPAN | Yuki Ishikawa | .340 | 9 | 47.1% | 14 | 13.1% | 5 |
| USA | TJ Defalco | .331 | 10 | 48.1% | 12 | 15.0% | 15 |
| FRANCE | Earvin Ngapeth | .329 | 11 | 50.4% | 7 | 17.5% | 20 |
| BRAZIL | Leal | .320 | 12 | 46.2% | 16 | 14.2% | 10 |
| RUSSIA | Egor Kliuka | .317 | 13 | 46.4% | 15 | 14.8% | 13 |
| ARGENTINA | Facundo Conte | .304 | 14 | 44.8% | 18 | 14.4% | 12 |
| ARGENTINA | Cristian Poglajen | .302 | 15 | 49.1% | 8 | 18.9% | 15 |
* Kill % Rank and Error % Rank are taken from all Outside Hitters with a minimum of 50 attack attempts from the tournament. *
Outside of the top four players who rank well across these three metrics, we start to see a higher degree of variation between kill percentage and error percentage ranks. We can appreciate these variations even more by visualizing this table with a scatterplot.
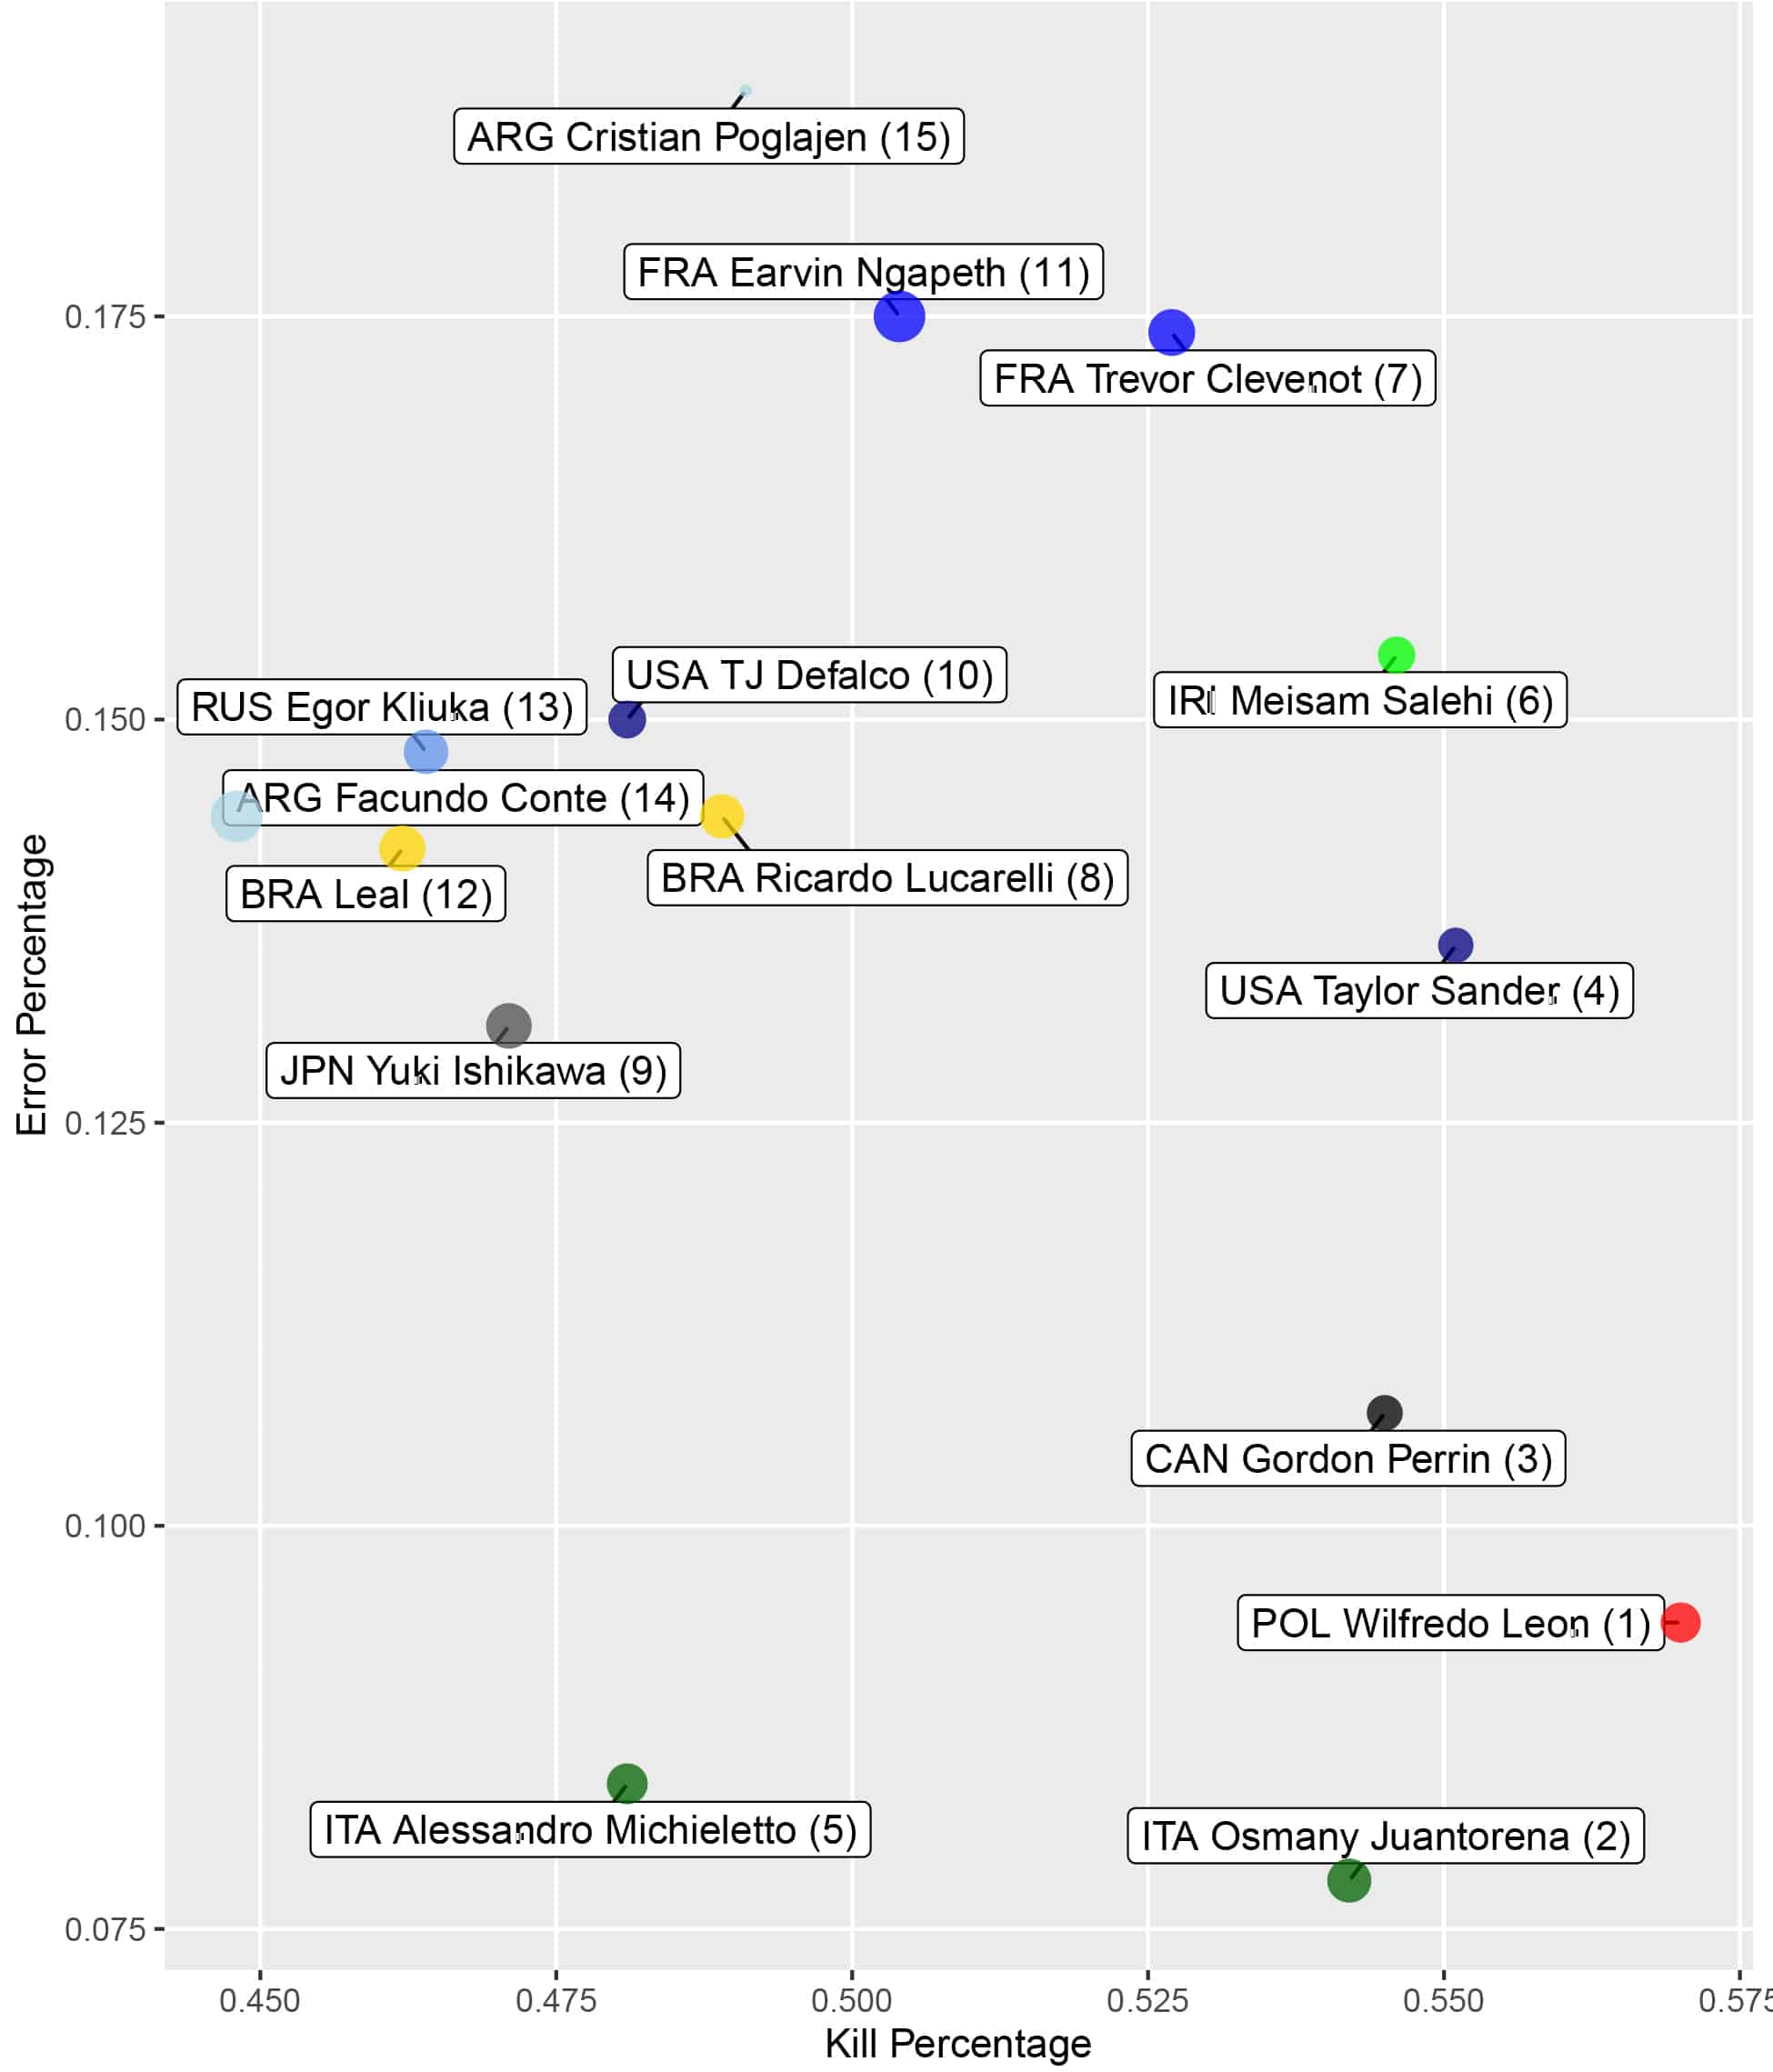
The top 3 in efficiency form a cluster to the bottom right with high kill and low error percentages, 8-14 with the exception of FRA’s Ngapeth (higher error percentage) are grouped together with lower kill and seemingly average error percentages, and 4-7 differ more by increasing error percentage and kill percentage, with the exception of ITA’s Michieletto (lower kill percentage, lower error percentage).
One of the main advantages of considering kill and error percentage separately instead of combined in attack efficiency is understanding whether a player is scoring at an acceptable rate as well as if the player is making errors at an acceptable rate. ITA’s Michieletto is a prime example of a player ranking highly in attack efficiency, but without looking at his kill percentage, especially in relation to the other OHs in the tournament, we may not have teased out that his kill percentage was on the lower end of this group. As a coach, this helps narrow our focus to know if a player needs to find more ways to score, or make better choices to minimize errors.
This leads to expanding upon Point 2, getting a better understanding of attacking performance with more
context. Not all attack attempts are equal, and yet when we look solely at attack efficiency, kill percentage,
or error percentage, none of these metrics take the difficulty of the attack attempt into account. So how do we integrate a measure of difficulty into attacking data? There may not be one single “right” answer to this question, but let’s dive into an example of how one might be able to do so using the general concept of Joe Trinsey’s “expected FBSO” metric for rating reception.
To give a quick overview of “expected FBSO”, Joe substituted average first ball kill percentages for corresponding ratings of reception (e.g. 3 point/perfect pass = .50 kill%, 2 point/medium pass = .40 kill%, etc.) based on the level of play in question. An advantage of using a system like this, instead of an arbitrary 3 or 4 point scale, is having a data backed “baseline” of what kill percentage “should be” relative to the quality of the first contact. Over a large enough sample of attack attempts (and preceding first contacts), a direct comparison could be made between actual kill percentage and “expected” kill percentage. In the following example, we’ll use this concept to calculate an expected kill probability (pred_won), but generalized to all first contacts. A sample of the data is shown below for POL’s Wilfredo Leon.
| SAMPLE ATTACK DATA | |||||
| TEAM | PLAYER NAME | SKILL | RESULT | ATTACK TYPE | PRED_WON |
| POLAND | Wilfredo Leon | Attack | KILL | GO | 38.6 % |
| POLAND | Wilfredo Leon | Attack | KILL | OVERPASS | 58.7 % |
| POLAND | Wilfredo Leon | Attack | KILL | GO | 53.5 % |
| POLAND | Wilfredo Leon | Attack | IN PLAY | GO | 57.7% |
| POLAND | Wilfredo Leon | Attack | KILL | BIC | 54.5 % |
Now that we have attack result and a corresponding kill probability, we can calculate kill percentage as usual, but can also take the average of all the kill probabilities tied to each of these attacks. With an actual kill percentage and an expected kill percentage (EXP. KILL %), we can take the difference of the two (EXP. DIFF.) to see how far above or below a player scored relative to the quality of the first contact.
| KILL PERCENTAGE OVER EXPECTED vs HITTING % | |||||||
|---|---|---|---|---|---|---|---|
| TEAM | PLAYER NAME | KILL % | EXP. KILL % | EXP. DIFF. | EXP. DIFF. RANK | KILL % RANK | HIT % RANK |
| POLAND | Wilfredo Leon | 57.0% | 46.0% | 11.1% | 1 | 1 | 1 |
| USA | Taylor Sander | 55.1% | 45.2% | 9.9% | 2 | 2 | 4 |
| IRAN | Meisam Salehi | 54.6% | 46.1% | 8.5% | 3 | 3 | 6 |
| CANADA | Gordon Perrin | 54.5% | 47.3% | 7.2% | 4 | 4 | 3 |
| FRANCE | Trevor Clevenot | 52.7% | 45.9% | 6.8% | 5 | 6 | 7 |
| ITALY | Osmany Juantorena | 54.2% | 47.4% | 6.8% | 6 | 5 | 2 |
| FRANCE | Earvin Ngapeth | 50.4% | 43.8% | 6.6% | 7 | 7 | 11 |
| BRAZIL | Ricardo Lucarelli | 48.9% | 45.5% | 3.4% | 8 | 9 | 8 |
| ITALY | Alessandro Michieletto | 48.1% | 45.8% | 2.3% | 9 | 11 | 5 |
| USA | TJ Defalco | 48.1% | 46.1% | 2.1% | 10 | 12 | 10 |
| ARGENTINA | Cristian Poglajen | 49.1% | 47.3% | 1.8% | 11 | 8 | 15 |
| JAPAN | Yuki Ishikawa | 47.1% | 45.4% | 1.7% | 12 | 14 | 9 |
| BRAZIL | Leal | 46.2% | 44.7% | 1.5% | 13 | 16 | 12 |
| RUSSIA | Egor Kliuka | 46.4% | 46.3% | 0.1% | 14 | 15 | 13 |
| ARGENTINA | Facundo Conte | 44.8% | 45.6% | -0.8% | 15 | 18 | 14 |
Including expected kill % and expected difference to our original metrics add very insightful context to attacking performance that hitting %, kill %, and error % cannot show on its own. Of course, Leon’s kill % and hitting % are impressive in their own right, but the expected difference shows that he killed an excess of 11% of the balls than what he “should have”, relative to the difficulty of the attempts he took. The expected kill % metric also highlights the general difficulty of the attacks FRA’s Ngapeth took relative to other OHs in the tournament, and he still managed to outperform that mark by 6.6%. From a coaching standpoint, this can help shed some light on the kinds of situations players are getting set in more often, and how they are performing relative to that standard. This could also spark further investigation by breaking out attack types or in system/out of system designations to pinpoint particular strengths and weaknesses.
To wrap up, understanding the information metrics don’t tell us is just as important as understanding what they do tell us. Taking this concept into account can help us make apples to apples comparisons when using data, or at the very least, be more keenly aware of the limitations of the metrics we use.